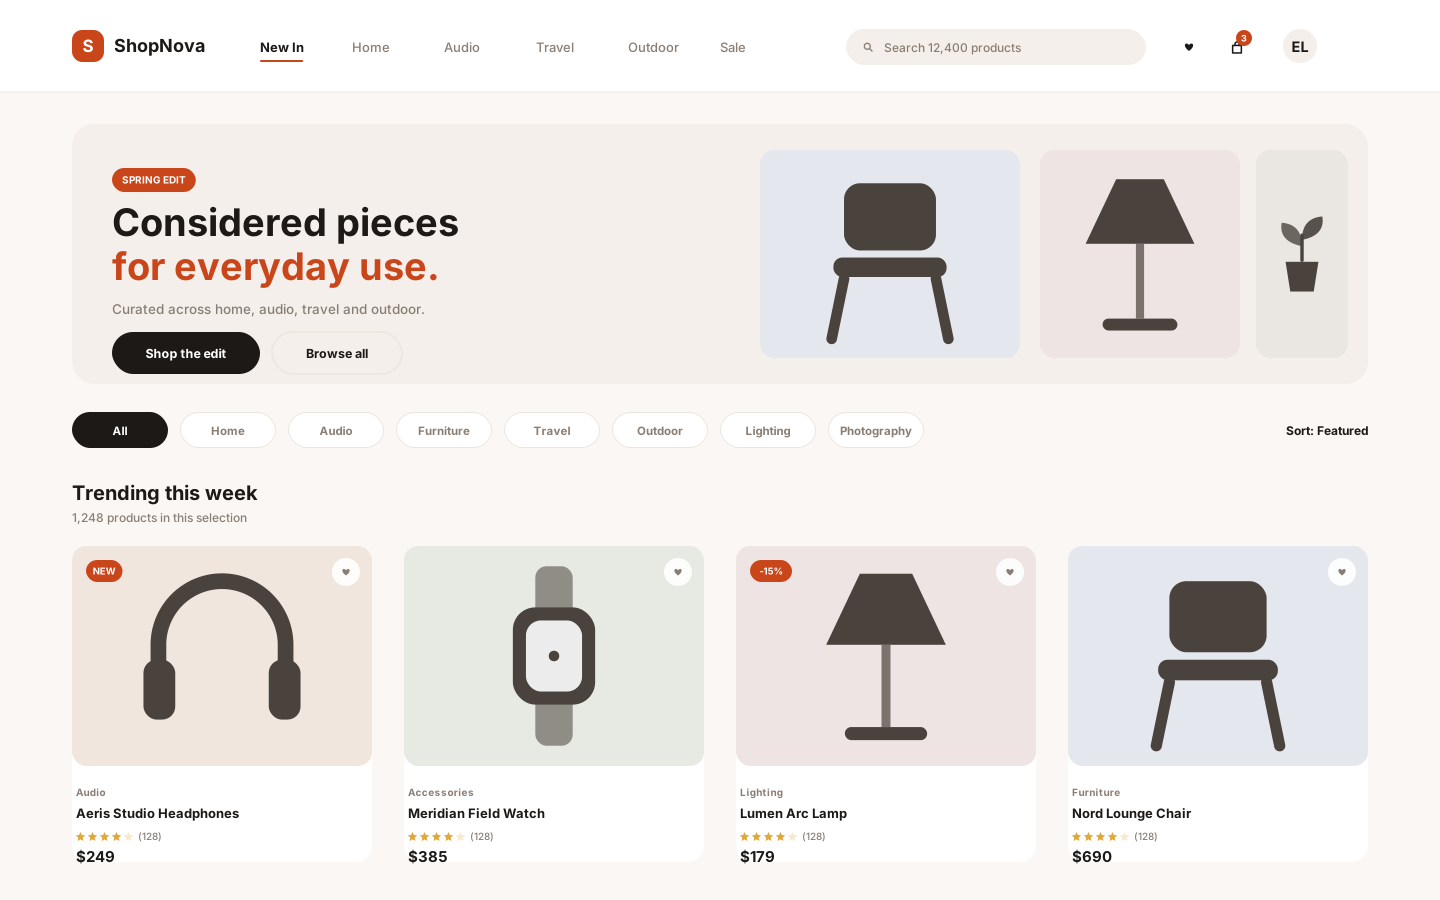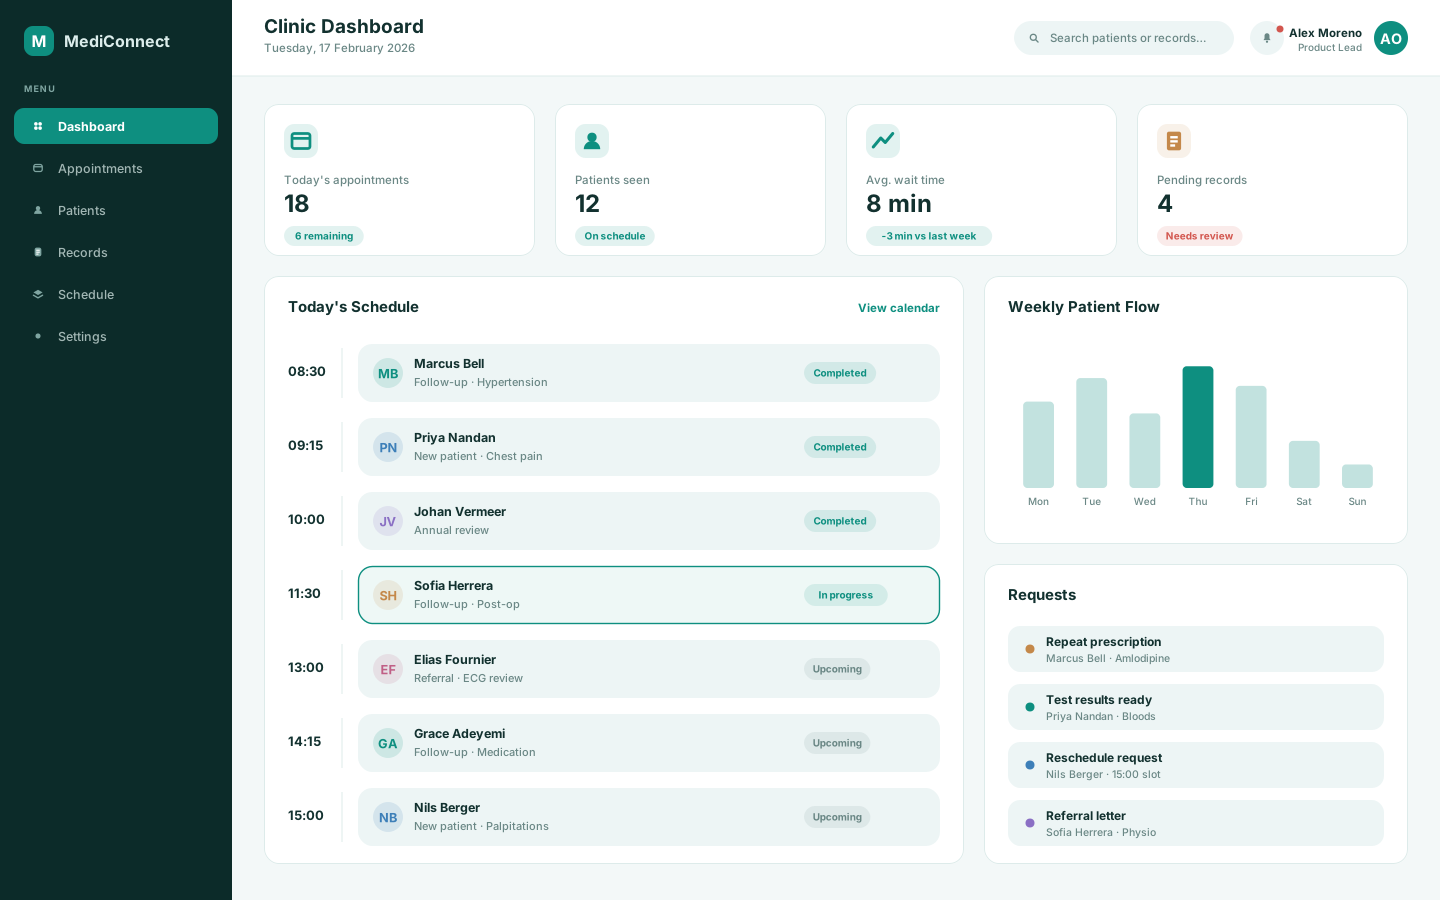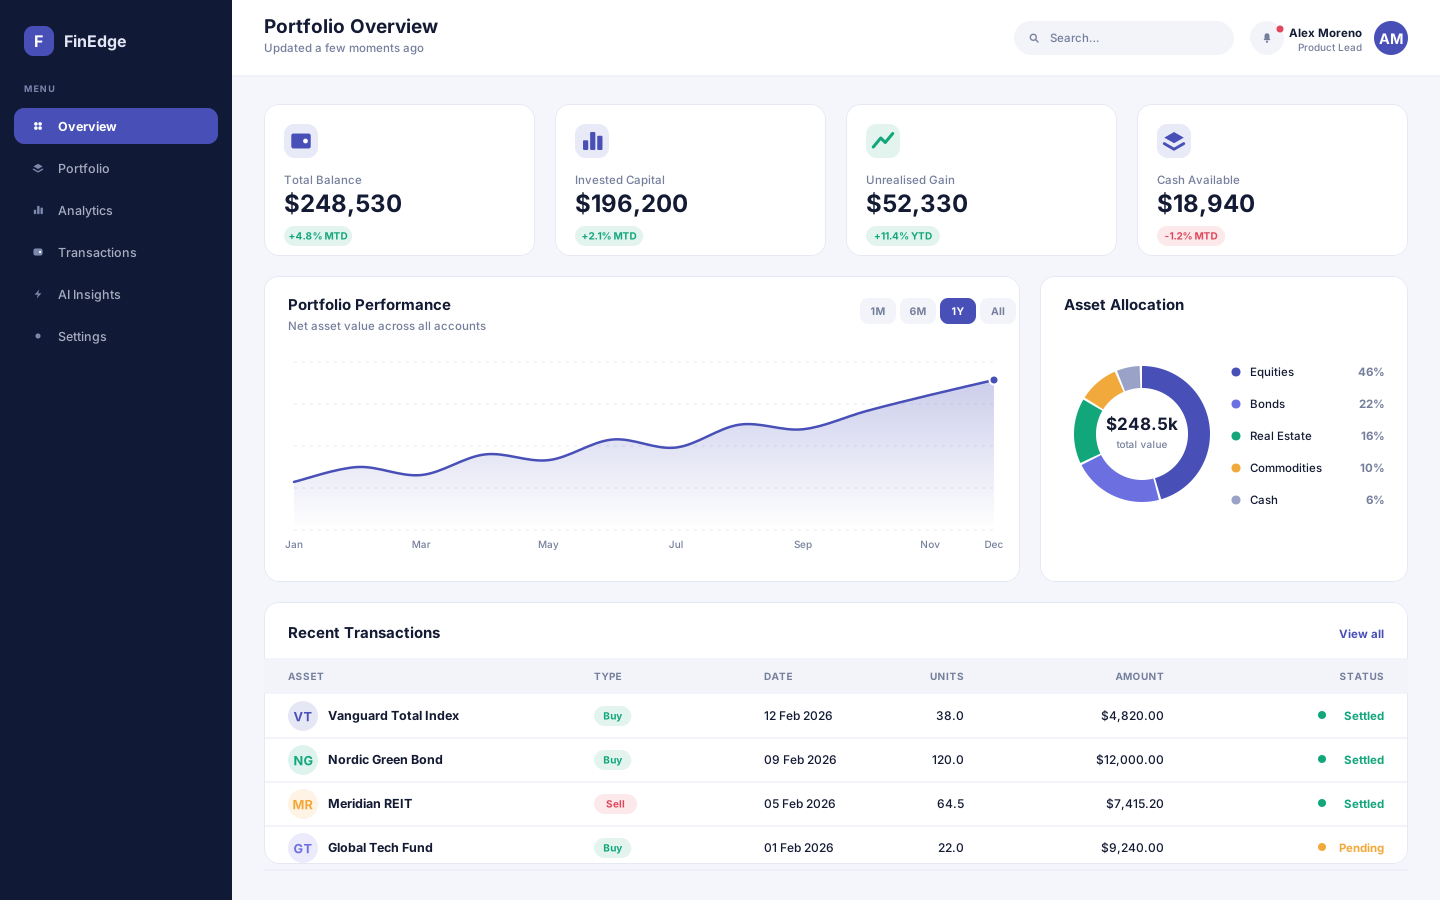
A financial analytics and portfolio management platform that turns scattered account data into decisions people can actually act on.
- React
- Node.js
- Python
- PostgreSQL
One dashboard for every deploy, every region
A concept cloud operations platform that unifies deployment pipelines, infrastructure health and cost tracking across every cloud environment.
Overview
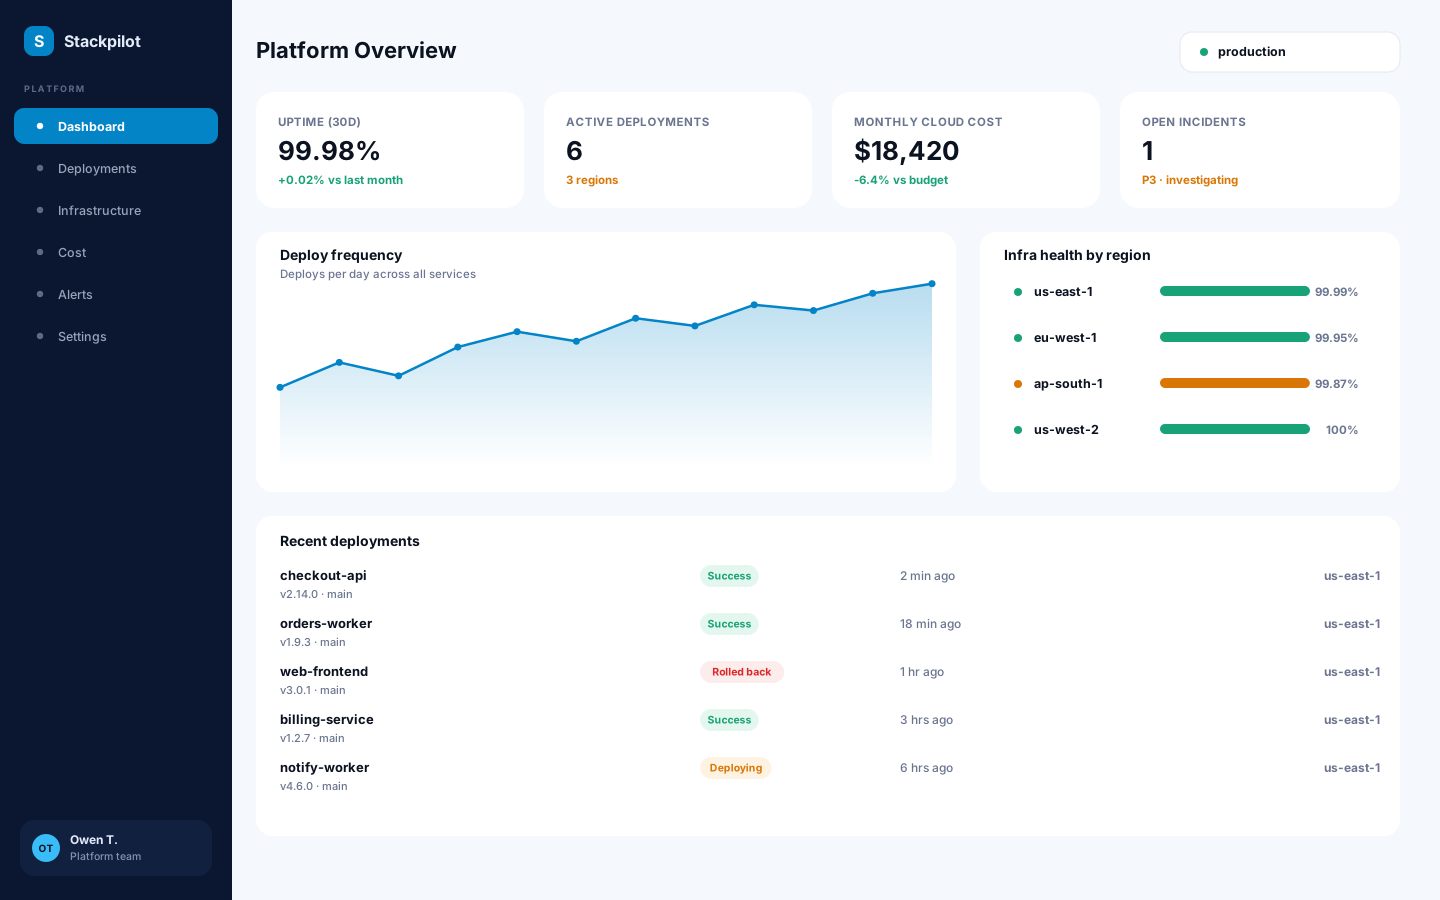
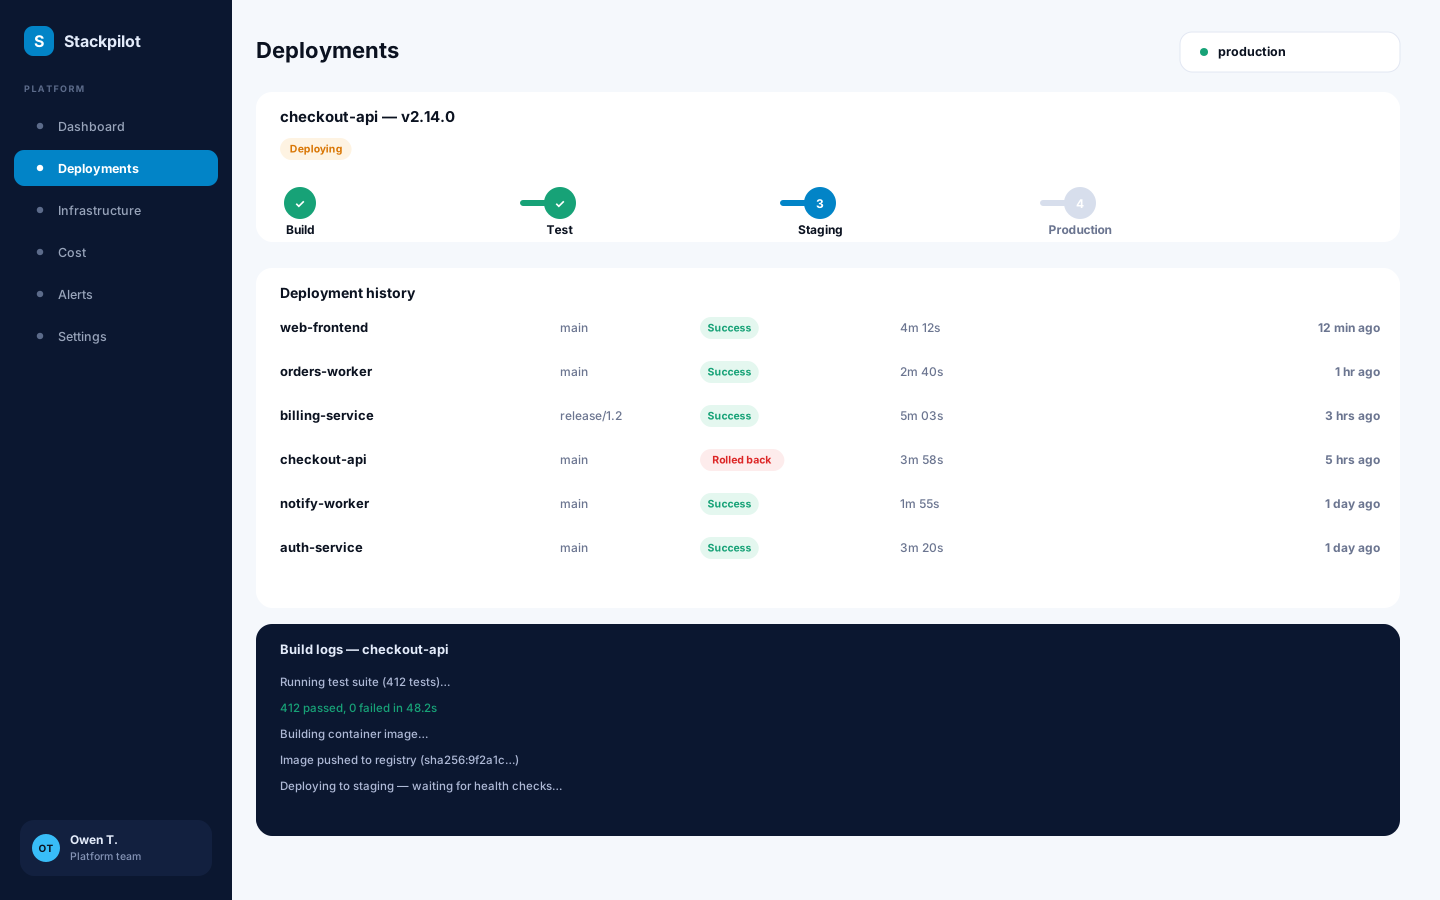
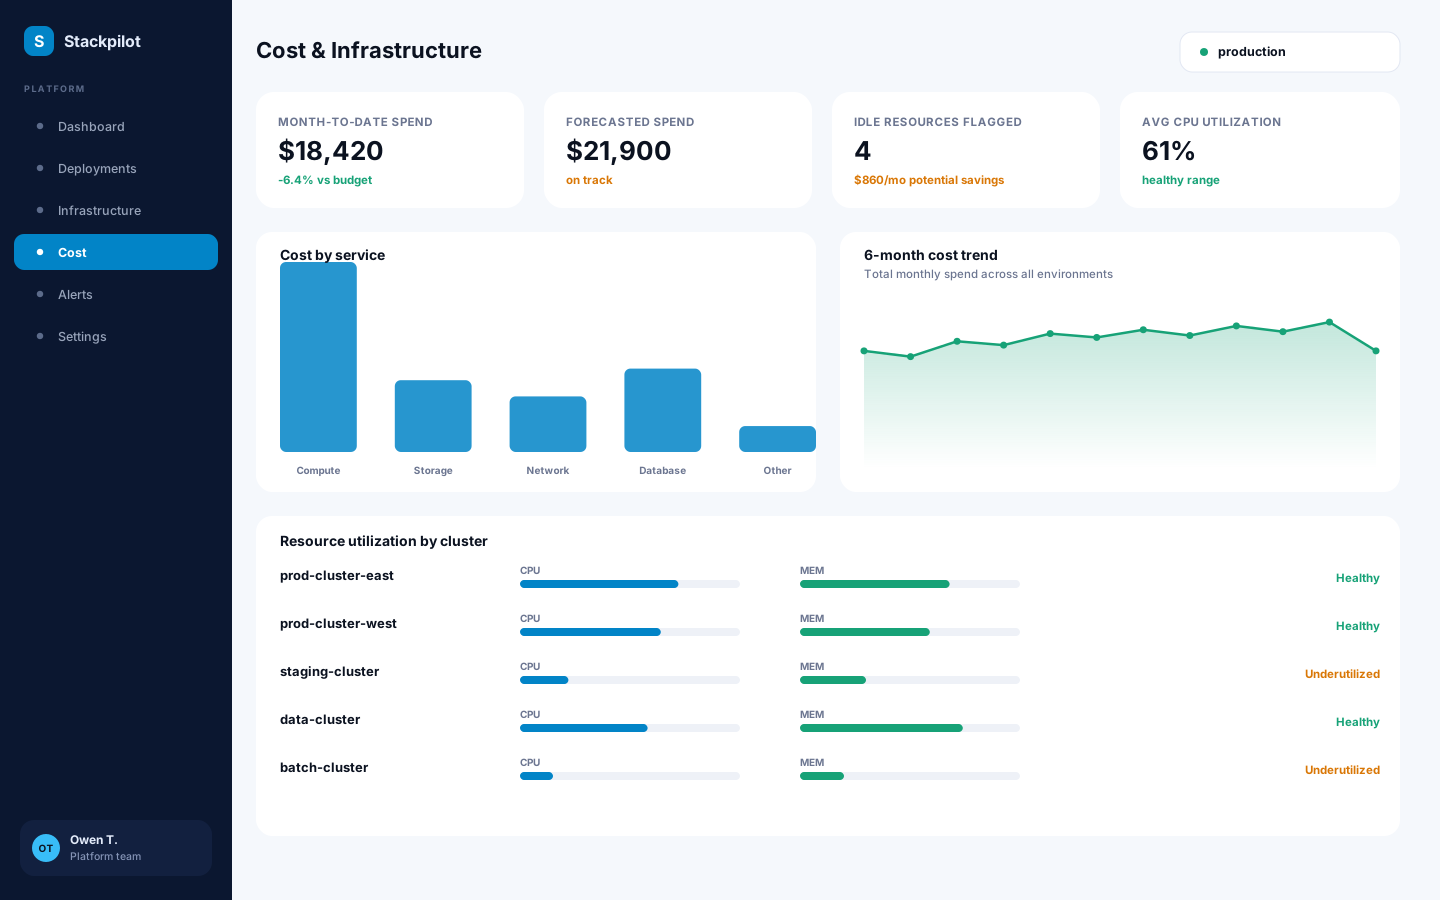
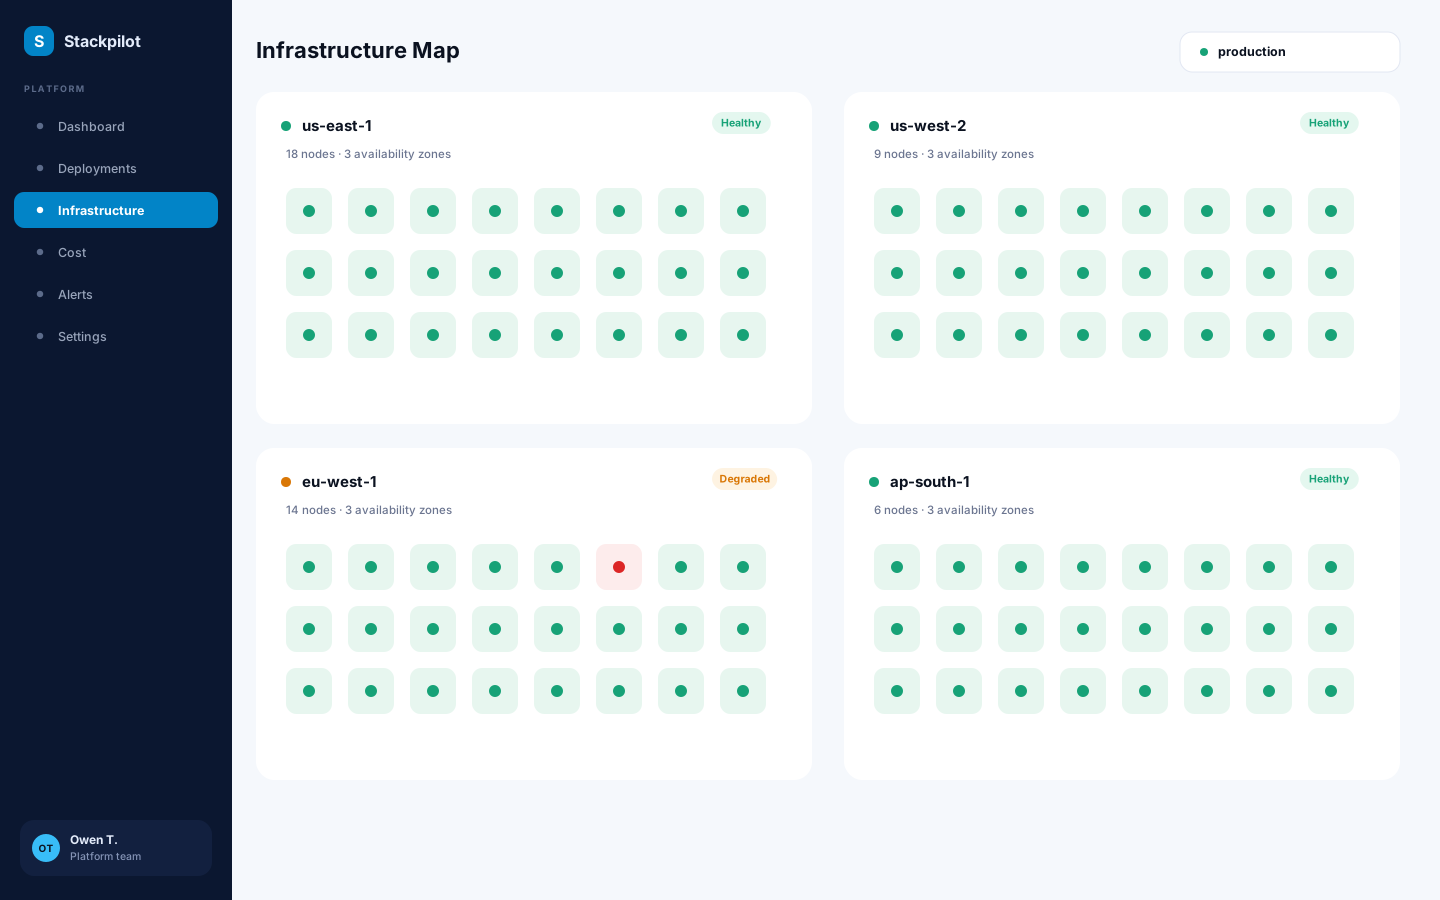
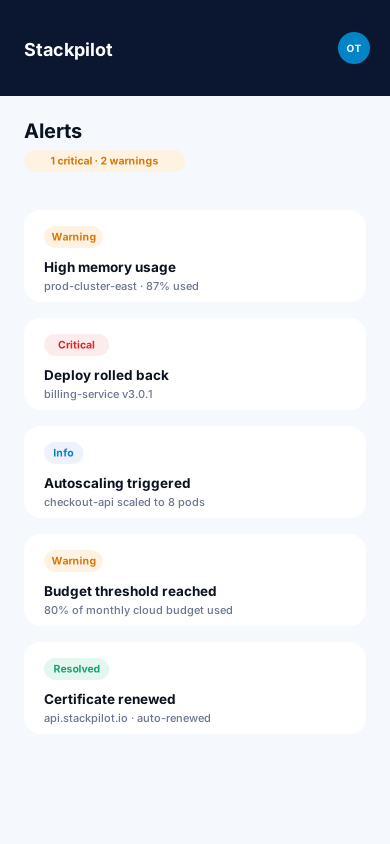
Stackpilot is a concept product for platform teams running services across several cloud regions, where deploy status, infrastructure health and monthly spend usually live in three different tools. It brings the deployment pipeline, the infrastructure map and the cost dashboard into one operational view, so a platform engineer can see what shipped, what's healthy and what it costs without switching context. The design problem was surfacing risk early: a rollback, a degraded region or a budget overrun needs to be visible the moment it happens, not discovered during a postmortem.
Platform teams typically check three separate tools to answer one question: is this release safe to ship. The CI/CD tool shows pipeline status, the cloud console shows infrastructure health, and a spreadsheet or a third dashboard shows what it's all costing — so a rollback, a degraded region and a budget spike are each discovered separately, usually after something has already gone wrong.
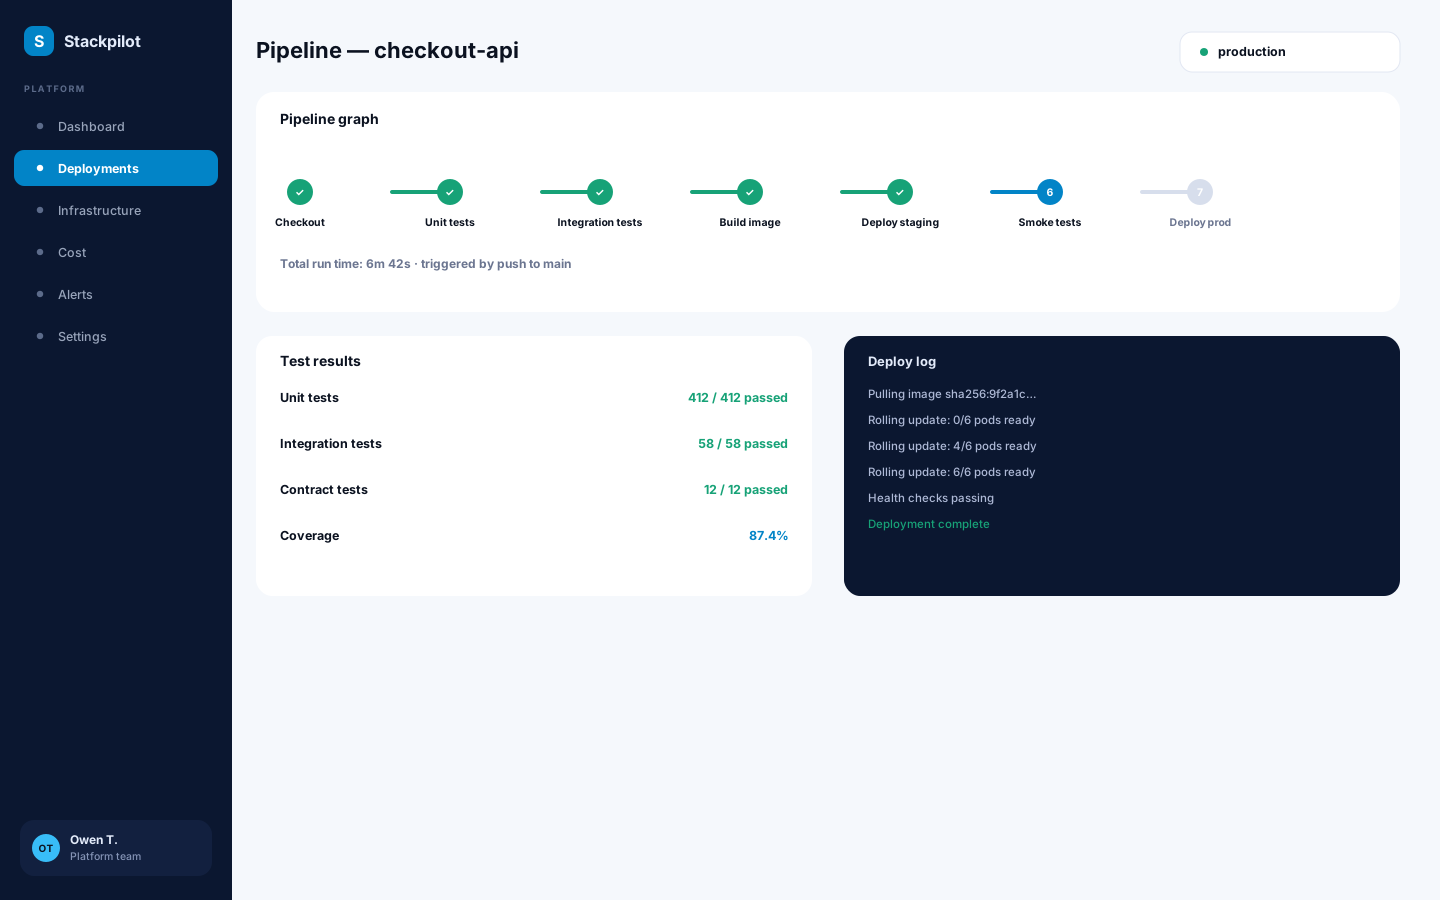
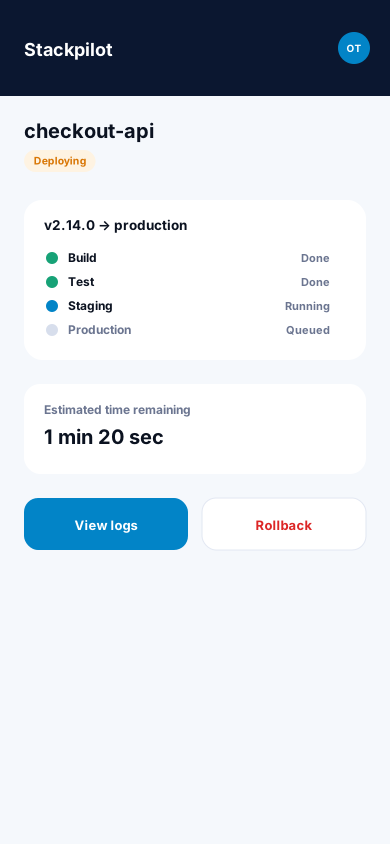
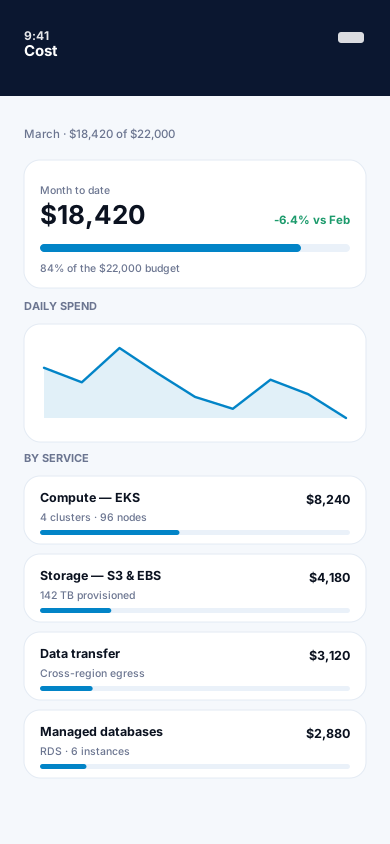
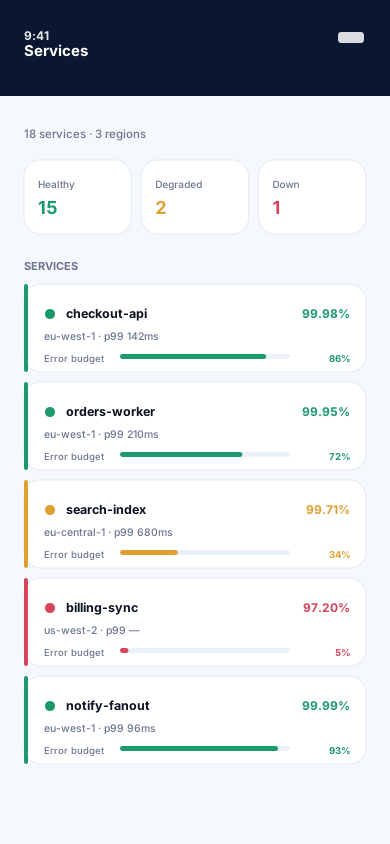
We built the deployment, the infrastructure map and the cost view around one shared data model, so a service's pipeline status, the health of the region it runs in, and its cost trend sit on the same screen. Deployments show their pipeline stage in real time with logs attached, the infrastructure map flags a degraded region before it becomes an incident, and the cost view calls out idle resources as they're found rather than at the end of the month.
Desktop
The full-width interface, screen by screen.
Mobile
The same information hierarchy, rebuilt for a screen you hold in one hand.
More work
(→)Start a project
Tell us what you have in mind and we'll come back with a clear scope, a realistic timeline and an honest opinion on the best way to build it.
Project brief