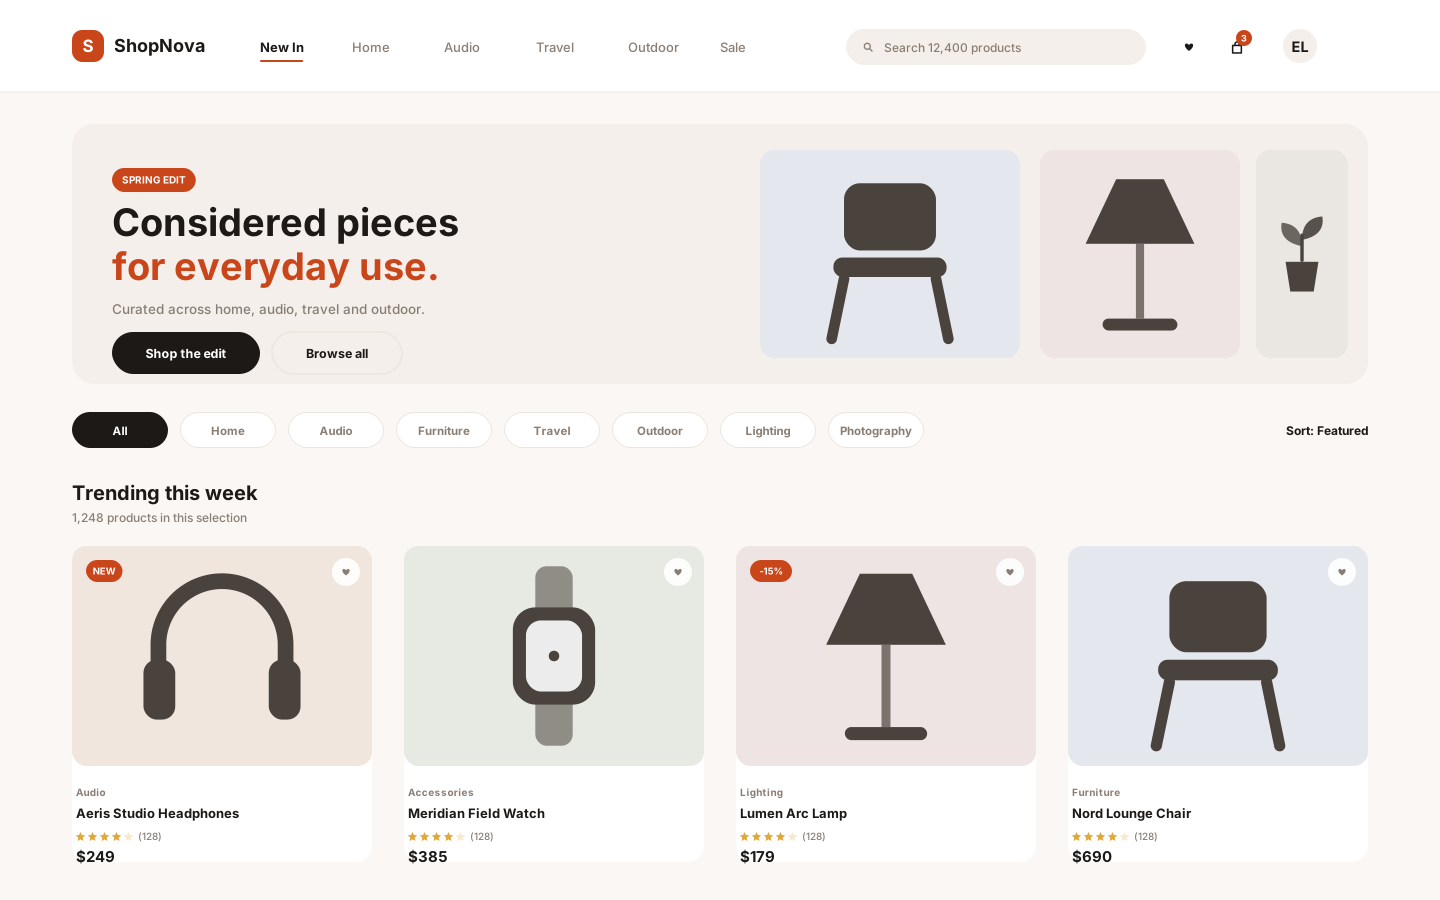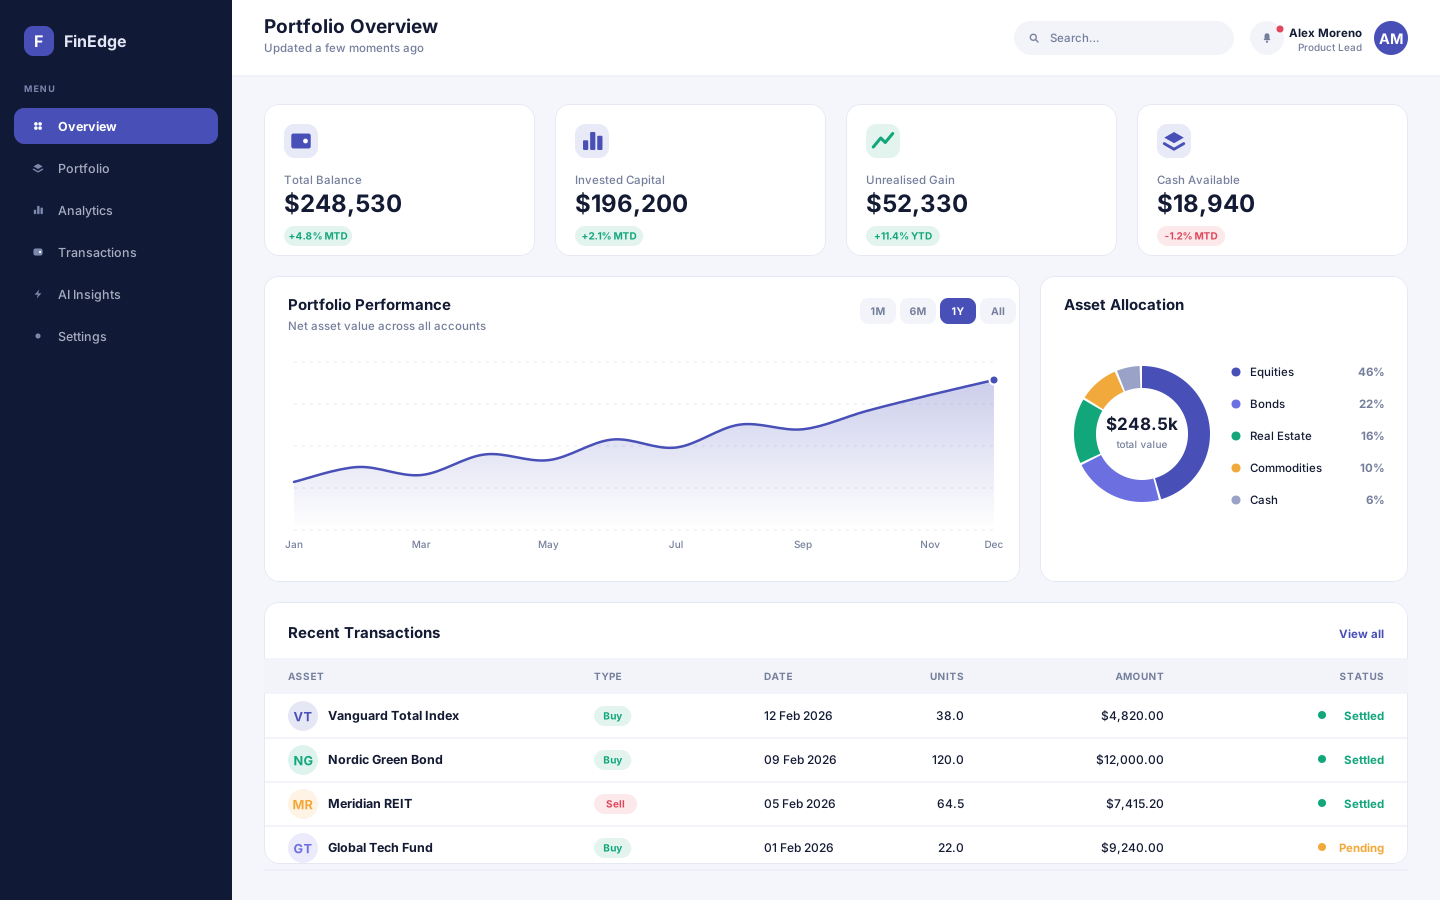
A financial analytics and portfolio management platform that turns scattered account data into decisions people can actually act on.
- React
- Node.js
- Python
- PostgreSQL
Every channel, measured the same way
A marketing attribution and campaign analytics platform that puts paid, organic and lifecycle performance on one comparable footing.
Overview
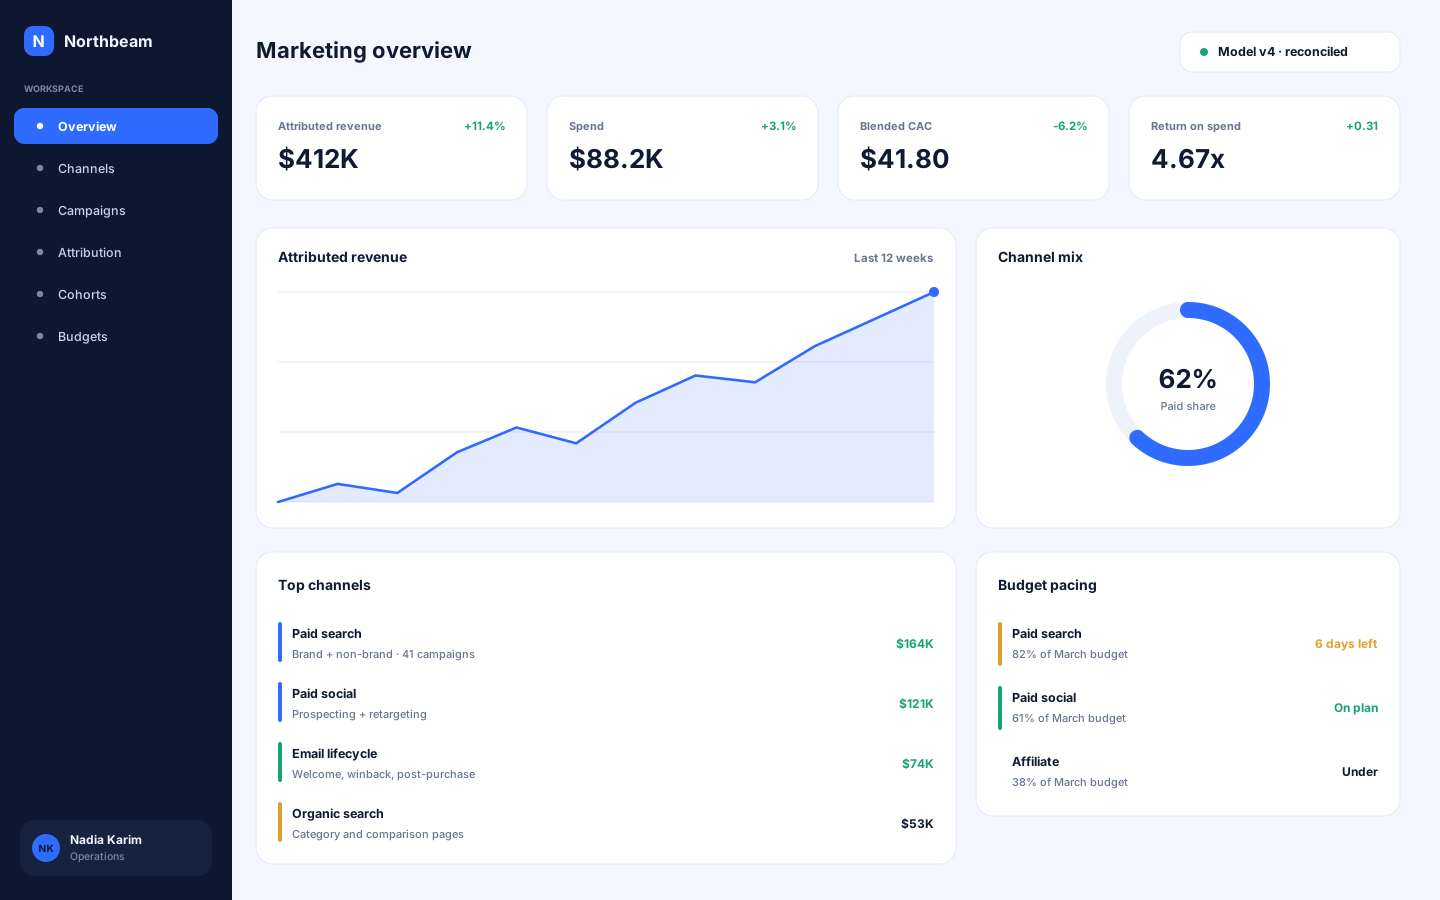
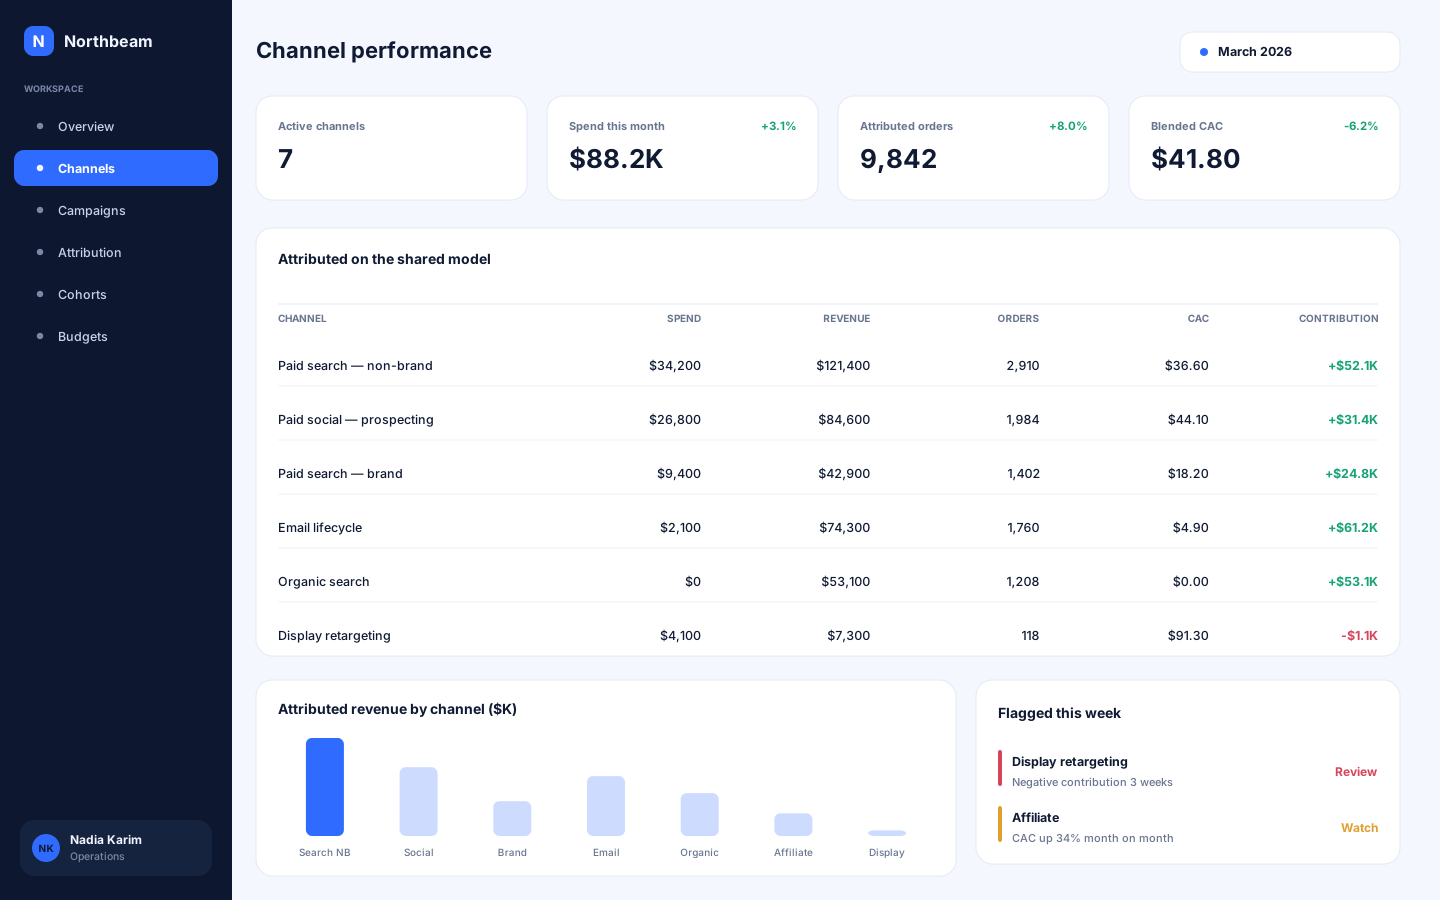
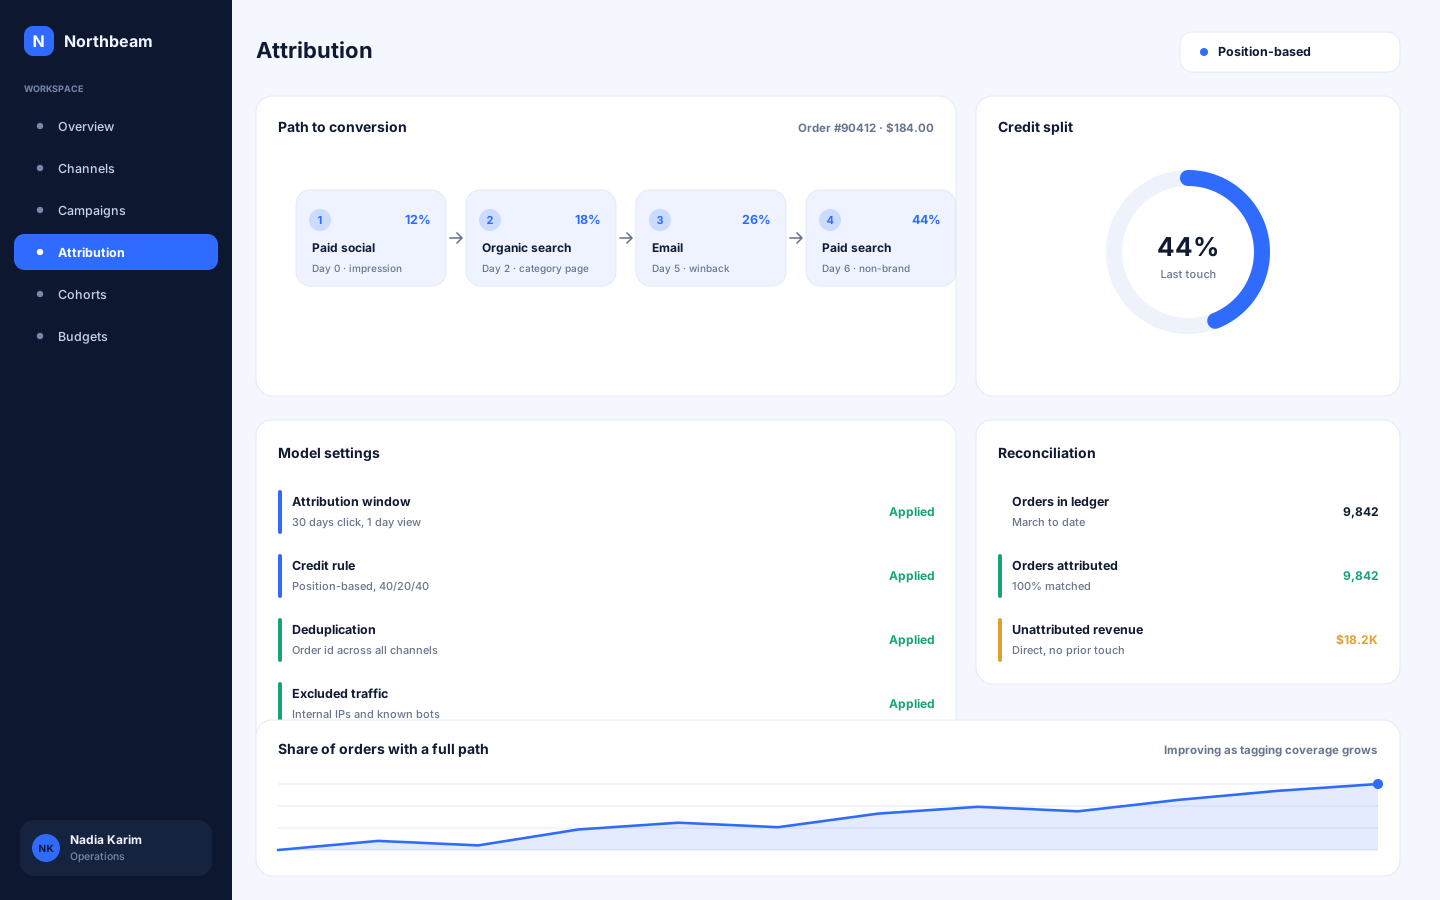
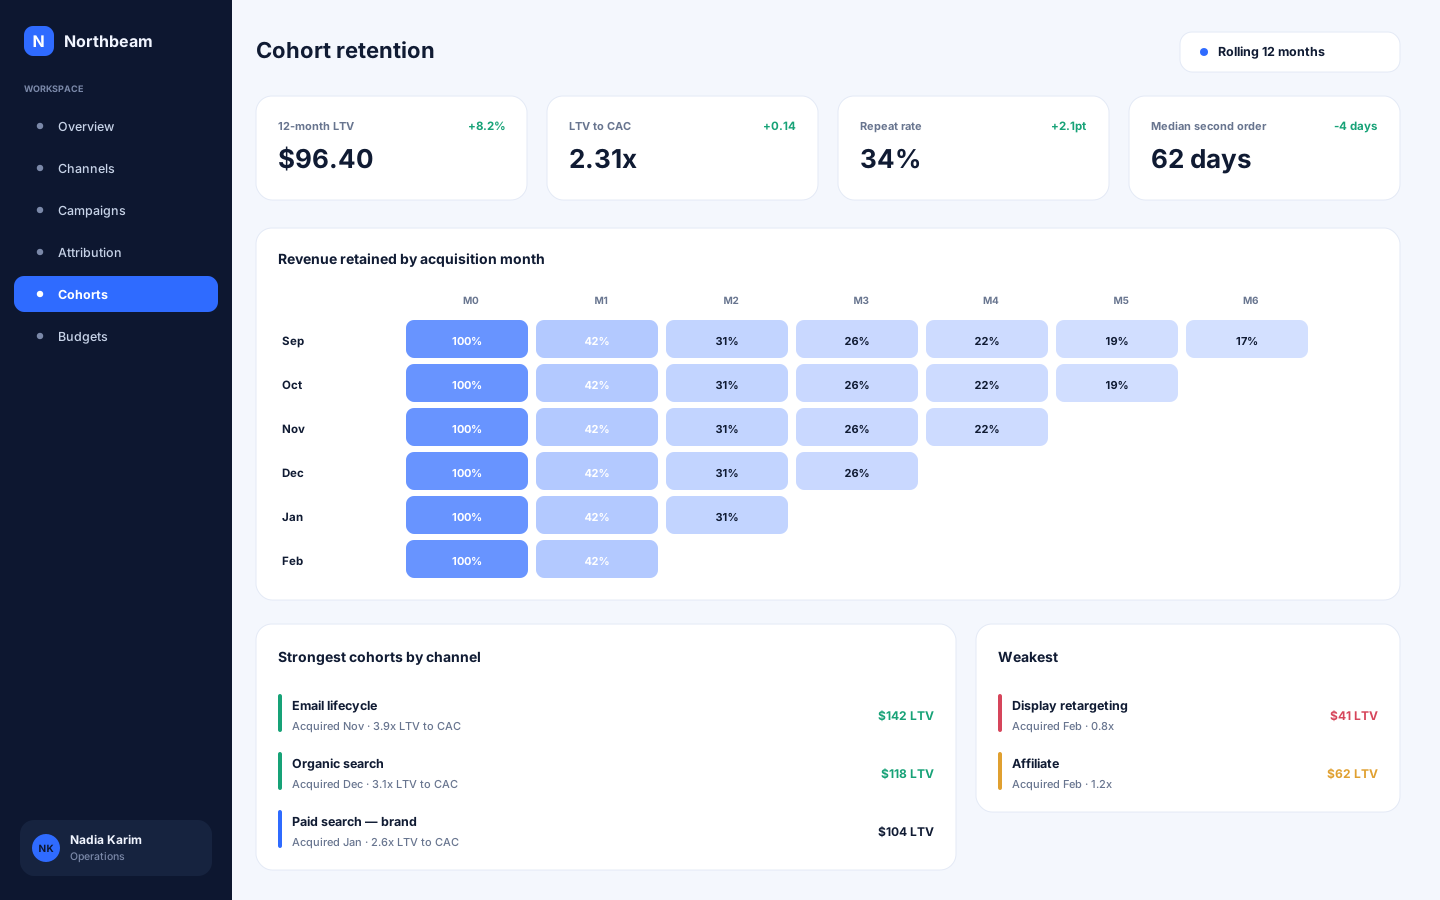
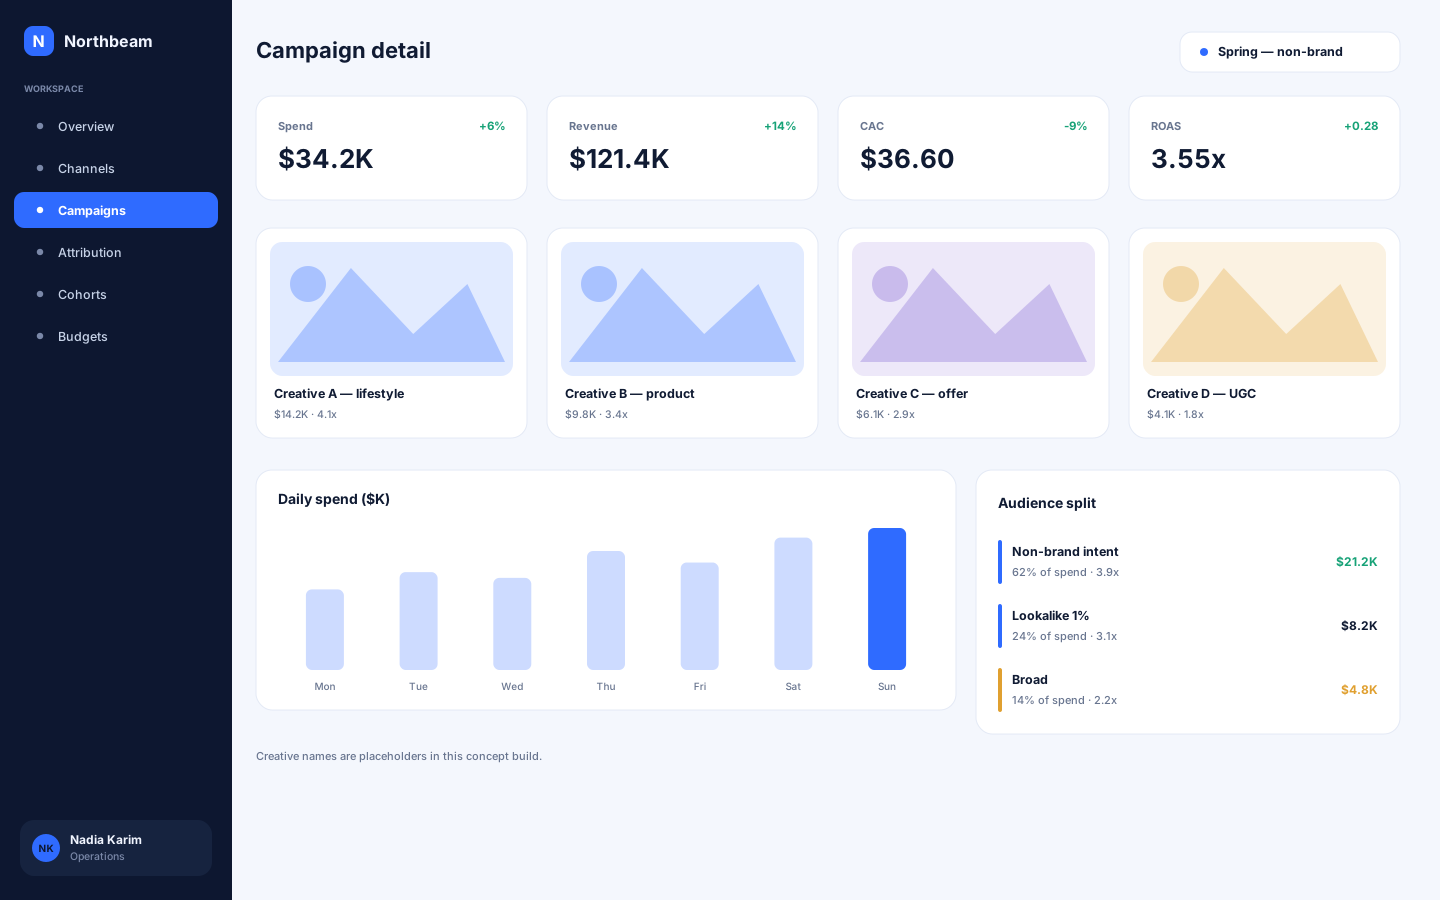
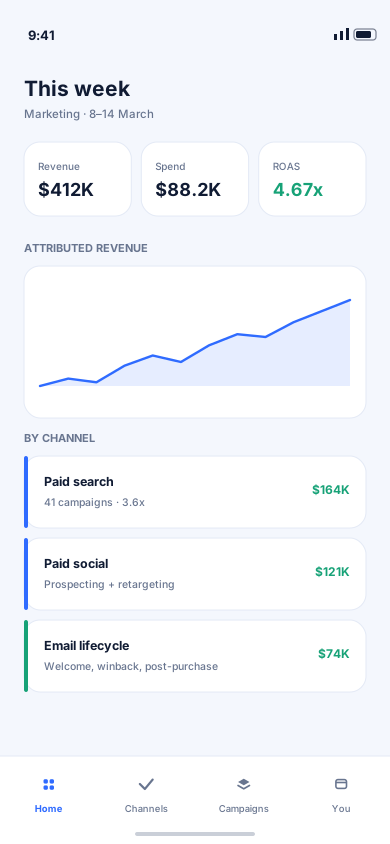
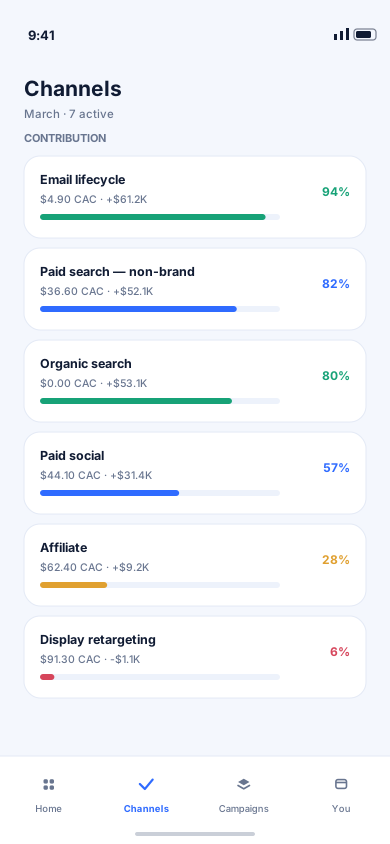
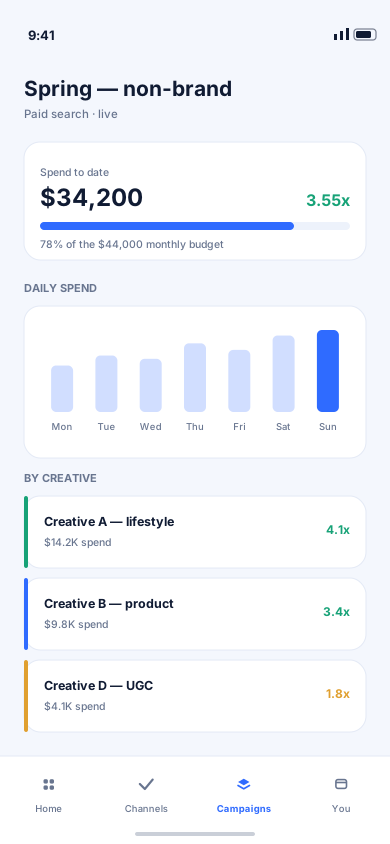
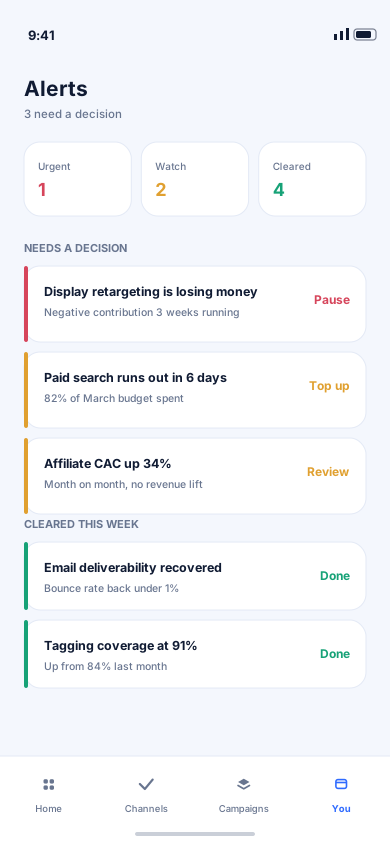
Northbeam is a concept product for marketing teams whose spend is spread across six or seven channels, each reporting on itself in its own dashboard with its own definition of a conversion. It pulls ad platforms, site analytics and the order table into one model, applies a single attribution rule across all of them, and shows what each channel actually contributed. The design problem was trust: a number nobody believes is worse than no number, so every figure can be opened to reveal the events behind it.
Each ad platform reports the conversions it can see and claims credit for them, so adding the dashboards together gives a number far larger than the orders that actually happened. Marketers end up rebuilding the picture by hand in a spreadsheet every Monday, and by the time it is reconciled the week it describes is already gone.
We modelled every touchpoint into one event table and applied a single attribution rule across all channels, so the numbers add up to the orders in the ledger. Channel performance, blended acquisition cost and contribution are computed from that one model, every figure opens to the events behind it, and the weekly reconciliation is a page rather than a morning's work.
Desktop
The full-width interface, screen by screen.
Mobile
The same information hierarchy, rebuilt for a screen you hold in one hand.
More work
(→)Start a project
Tell us what you have in mind and we'll come back with a clear scope, a realistic timeline and an honest opinion on the best way to build it.
Project brief